Wild land Fuel Breaks
What is a fuel break?
In the wild land, either on public managed lands or private, a true
fuel break is defined as a change of live and dead fuels that will
effect the observable fire behavior: rate of spread, flame length and
spotting. The rate of spread is measured at the flaming front as feet
per minute (which converts to chains per hour), the flame length is
measured in feet from the top of the fuel bed to the tip of the flame.
Spotting is a function of wind and the vertical arrangement of the
fuels.
So, in plain terms, a wild land fuel break will slow the fire spread
down, cause the flame length to diminish and reduce spotting.
The parts of a fuel break.
1 Maintain as
much shading as possible.
2 Maintain as
much eye level wind reduction as possible.
3 Keep dead
fuels to a minimum.
4 Keep live
fuels when ever possible
In a fuel break if we have an overhead canopy (trees) we want to keep
the ground shaded through out the day at 50% or more. This decreased
the surface temperature and thus the fuel temperature on the soil
surface. This fuel is often dead and of a small diameter (less than 1/2
“ in diameter).
We need to keep as much canopy and even some mid level vegetation, so
that we have a wind break. Reducing the eye-level wind speed is
important, as that directly effects the rate of spread of the
fire.
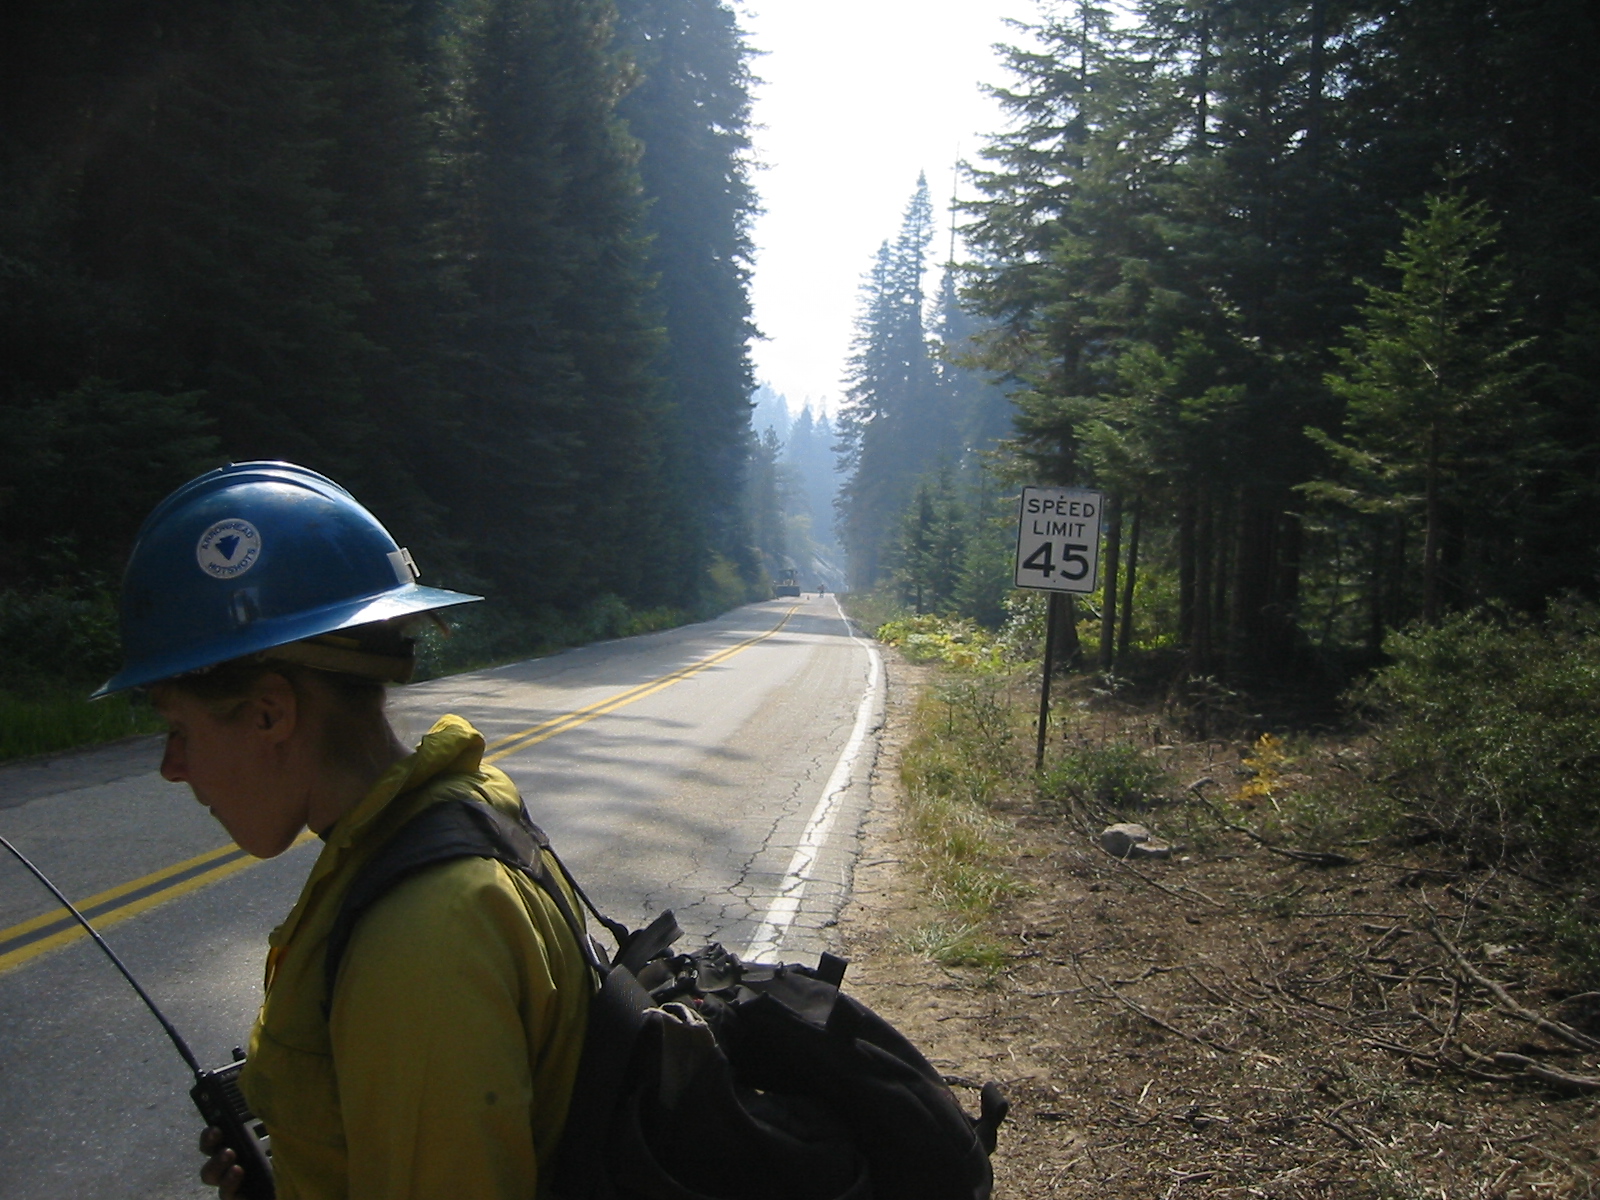
This is a fuel break! This is a highway that already existed before the
fire and was used as a 'fuel break' to become a section of the fireline
containing the wildfire. There is NO fuel to burn BUT there is no wind
reduction, so spotting will easily cross the break.
This fuel break is really a highway in the Kings Canyon Sequoia
National Park. It was successfully used as a fire line, to stop the
spread of a wild fire. To accomplish this, wild land fire engines, hand
crews and other resources were needed to catch any spots that crossed
the fire line. In addition the crews black lined the fire side of the
line. This is the action of using fire to remove the ‘kindling’ that is
next to the fire line on the fire side. This effectively widens the
fire line (fuel break). A fuel break by it’s self rarely is
successful at stopping the spread of a wild fire, as it needs to be be
staffed with competent wild land fire fighters.
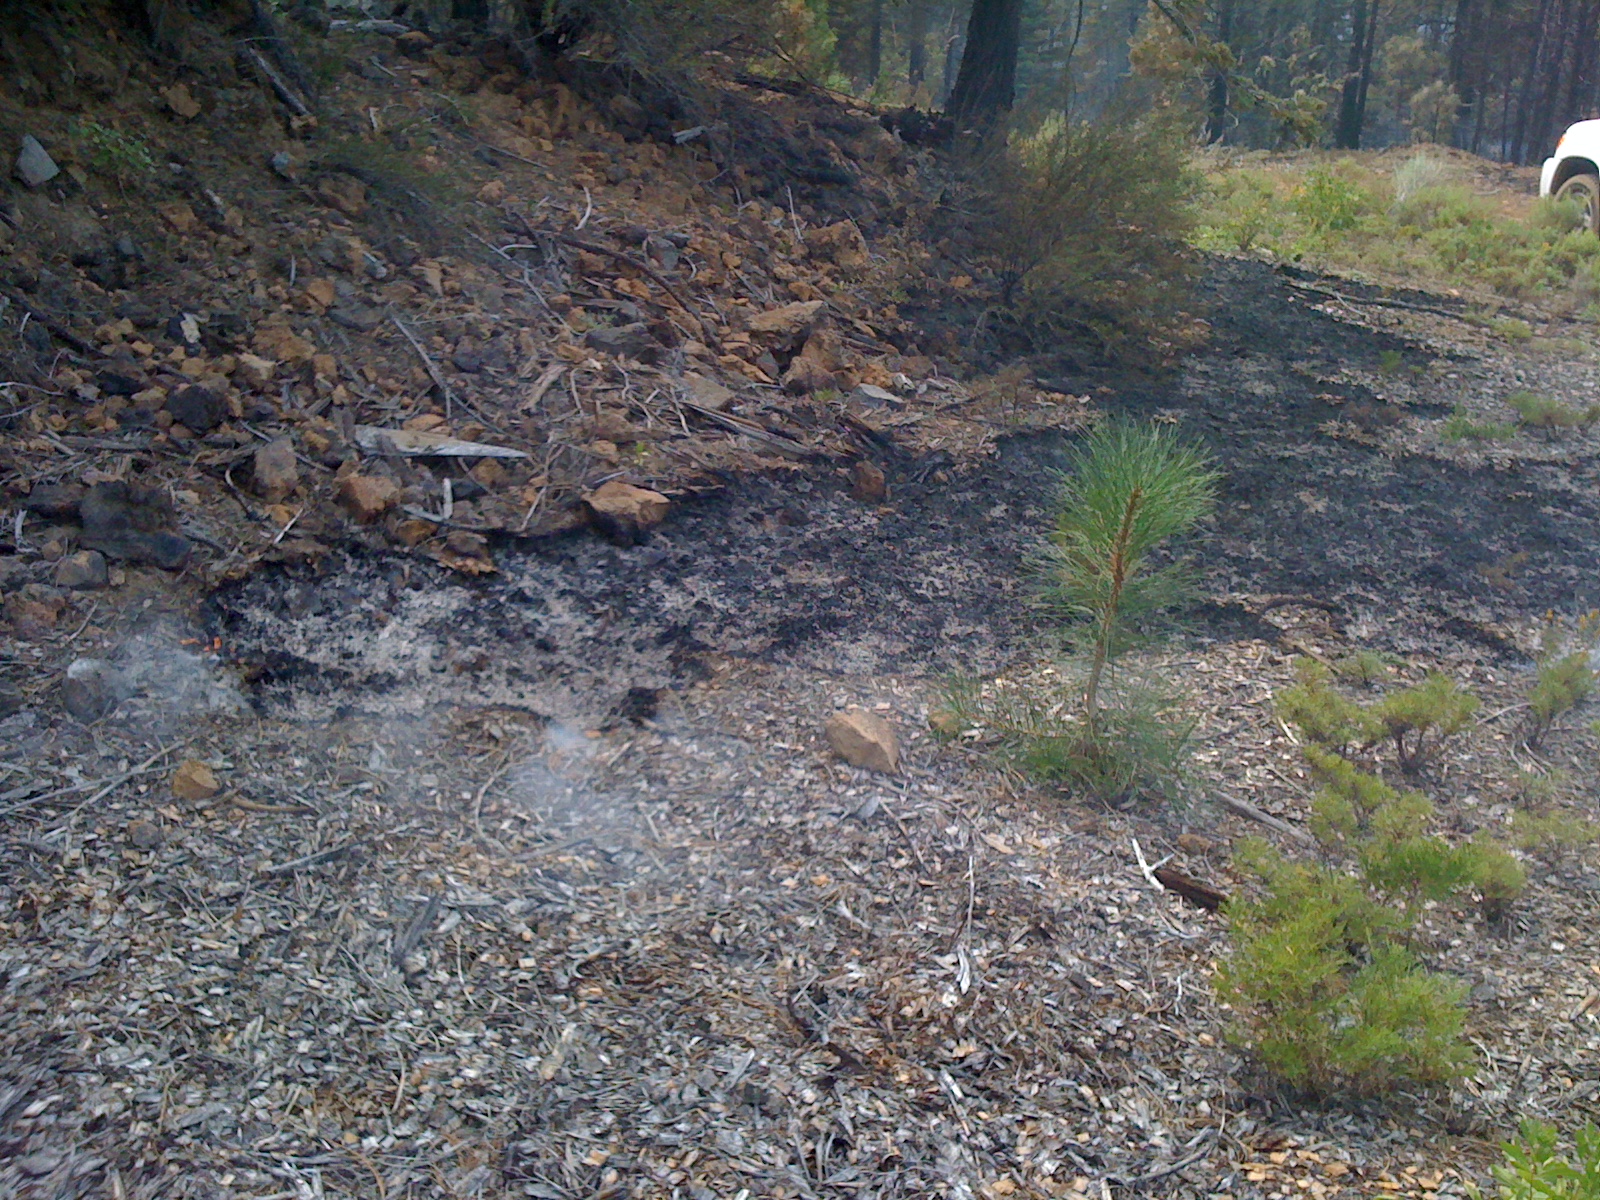
This is a picture of a ‘ground fire’ one that is smoldering below the
surface of the fuel layer. You will notice smoke and if flames
are present they will be small. This is an example of a ‘fuel break’
that did not stop the spread of the fire, but it did slow it down, as
well as reduce the flame length. Here the fire is spreading by
CONDUCTION on of the three methods of heat transfere (Conduction,
Convection and Radiation). This was taken on a wildfire near Hat Creek
California. The actual chipping was done to reduce harvest residue,
instead of burning it. Now, during a wildfire it is burning.
IN THIS CASE WOOD CHIPS ARE SUPPLYING THE AVENUE OF COMBUSTION FOR THE
FIRE TO SPREAD! CHIPPING OF LIVE AND DEAD FUEL HAS NO NATURAL ROLE IN A
WILD LAND !! IT IS AN URBAN LANDSCAPING TECHNIQUE!!!
The amount of fuel modification
necessary shall take into account the flammability of the structure
as affected by building material, building standards, location, and
type of vegetation. Fuels shall be maintained in a condition so that
a wildfire burning under average weather conditions would be
unlikely
to ignite the structure.
This quotation is taken from the California Public Resources Code 4291
a(2) verbatim. The key to this sentence is "a wildfire burning under
average weather conditions would be unlikely to ignite the structure".
What is the Average weather condition and where would we find it?
The U.S. Forest Service has tools that we can use to determine this
average condition. Here is a page that takes you to the Energy Release
Component (ERC) for each site listed. This does not show that average
weather conditions, but it does show a daily level of how hot a fire
would burn.
http://gacc.nifc.gov/oncc/predictive/fuels_fire-danger/yrsc/erc/index.htm
This link below will show the Shasta-Trinity National Forest Pocket
Card, which is a tool that is made and used by fire managers in the US.
Forest Service. The chart shows the maximum value and the average value
of the Burning index for each day in the fire season, using data from
ten years. In the lower chart two major fires and two of the most
important recent years: 2006 and 2008. In the top chart we can
see that the Average burning index (for ten years of data) only reaches
past the the 52 percentile from about July 8th to October 1. That means
that only 184 days each year were even in the fire season and of those
days only 48% had a Burning Index above 56. The Burning Index as
a great field tool because by dividing the BI by 10 we can get expect
flame lenght. In this instance it is 5.6 feet.
http://fam.nwcg.gov/fam-web/pocketcards/shastat.htm